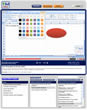
Change the Background Color and Effects of a Chart in Excel
This Chart Formatting Tutorial in Excel shows you how to change the background color of a chart in Excel. You will learn how to format the Chart Area and the Plot Area of a chart. The formatting features explained in this tutorial include adding different colors to the background; using gradients (colors that fade into other colors) for the background; adding pictures to the background; adding transparency effects to the background; and more. This is a great tutorial to view to learn about a lot of the formatting effects that you can add to the background (Chart Area and Plot Area) of a chart in Excel.
| Tutorial Length (mm:ss): |
9:38 |
Sign Up to View Tutorials
|
| Downloadable Files: |
Yes |
| Microsoft Office Program: |
Microsoft Office Excel |
| |
|
| Keywords: |
training background color chart effect picture gradient affect excel transparent transparency graph format formatting |
This Excel chart formatting tutorial shows you how to quickly add professional looking formatting to a chart in Excel. This tutorial covers a few different formatting features and tips that you can combine in order to get a very good looking chart with just a few mouse clicks. This is a great tutorial to view when you are learning about formatting charts in Excel.
| Tutorial Length (mm:ss): |
5:15 |
| Microsoft Office Program: |
Microsoft Office Excel |
| |
|
| Keywords: |
training format styles chart appearance professional good looking excel tips tricks graph formatting quick fast easy |
This Excel chart formatting tutorial shows you how to remove the border or outline that appears around a chart in Excel. This border appears by default and can get in the way of a coherent theme or style within the worksheet. Thankfully, this tutorial shows you how to quickly and easily get rid of the border around a chart in Excel.
| Tutorial Length (mm:ss): |
2:06 |
| Microsoft Office Program: |
Microsoft Office Excel |
| |
|
| Keywords: |
training border outline remove chart excel format formatting graph |
This Chart Formatting tutorial for Excel shows you how to format the text within a chart in Excel. You will learn how to change the size, color, font, and more for all text that is contained within a chart in Excel. This is a great tutorial to watch if you need to make formatting changes to the text in a charts title, legend, X axis, Y axis, or anywhere else within a chart.
| Tutorial Length (mm:ss): |
4:06 |
| Microsoft Office Program: |
Microsoft Office Excel |
| |
|
| Keywords: |
training format text font chart excel size color bold italics size format formatting graph |
This Excel Chart tutorial shows you how to add a hover effect to a chart in Excel. This effect makes it so that a chart looks like it is hovering or floating above a worksheet in Excel. This is a great formatting feature to use to make charts and spreadsheet data more interesting to read. This tutorial also covers some other similar formatting features for charts in Excel.
| Tutorial Length (mm:ss): |
3:03 |
| Microsoft Office Program: |
Microsoft Office Excel |
| |
|
| Keywords: |
training hover hovering effect affect chart excel float floating add insert create format formatting |
This Excel Chart Formatting tutorial shows you how to add effects to the text within a chart. You will learn how to edit the effects of a charts title, legend, X axis labels and title, Y axis labels and title, and any other text within a chart in Excel. This tutorial shows you everything you need to know to change the appearance of text within a chart in Excel.
| Tutorial Length (mm:ss): |
5:58 |
| Microsoft Office Program: |
Microsoft Office Excel |
| |
|
| Keywords: |
training effects format text font chart excel color special shadow reflection quick easy format formatting graph |
This Excel Chart Tutorial shows you how to make a 3-D chart in Excel. This tutorial will show you how to make a 3-D chart from scratch as well as how to turn a 2-D chart into a 3-D chart. Also, you will learn about some of the main formatting and layout features related to 3-D charts in Excel. This is the tutorial that you need to watch if you want to create 3-D charts in Excel.
| Tutorial Length (mm:ss): |
6:11 |
| Microsoft Office Program: |
Microsoft Office Excel |
| |
|
| Keywords: |
training 3d 3-d chart in excel three dimensional 3 make create insert type edit |
This Chart Formatting tutorial for Excel shows you how to vary the colors of a column, bar, pie slice, or any series of data points within a chart in Excel. You will learn the quick and easy way to either vary colors or get the same colors for data points within a chart. This means that you will be able to change a series of one color columns into a series of different colored columns, turn all pie slices into the same color, and so on, all with just a few mouse clicks.
| Tutorial Length (mm:ss): |
4:34 |
| Microsoft Office Program: |
Microsoft Office Excel |
| |
|
| Keywords: |
training vary data point column colors alternate change alternate chart pie slice bar excel graph |
This Chart Formatting tutorial for Excel shows you how to change the color of a single data point within a chart. A data point is a column, bar, pie slice, or any other element of the data series. In this tutorial, you will learn how to change an individual data point without changing anything else. For instance, this allows you to make a particular column stand out within a chart. This is a very helpful feature to use when you want users to focus on specific data within a chart.
| Tutorial Length (mm:ss): |
5:35 |
| Microsoft Office Program: |
Microsoft Office Excel |
| |
|
| Keywords: |
training change color single column bar pie slice chart excel graph data point isolate |
This Chart tutorial for Excel shows you how to make a chart invisible or hidden. You will learn how to toggle the visibility of a chart in Excel. This is a very helpful feature to use if you dont want a user to be able to see all of the charts within a worksheet or when you just want to clean up the appearance of a worksheet without actually deleting any charts.
| Tutorial Length (mm:ss): |
2:45 |
| Microsoft Office Program: |
Microsoft Office Excel |
| |
|
| Keywords: |
training make invisible visible chart excel disappear hidden hide visibility graph |